All settings are stored in the URL. This is updated every time you make a change.
 Noise Mapping Tool
...
Disclaimer - please note:
It is important to read through this guide before using this tool or its calculations. By using the model you are accepting our terms of use.
Introduction
What is the dBmap.net Noise Mapping Tool?
The dBmap.net Noise Mapping Tool is for modelling external sound propagation, calculating decibel levels from sources of environmental and industrial noise and the screening effects of buildings and barriers.
This is a web app, developed for learning about and implementing the calculations of ISO-9613 and for creating interactive models that are freely accessible.
Please read through this guide. You can print this page and you can access it again at any time from within the Global Settings sidebar.
Software that runs in the browser

Save your model by bookmarking the page or share the link. Click here for more information
The browser back button will "undo" changes.
Computer requirements
Any up-to-date web browser. Calculation times will depend on the processing power of your device.
This tool is free to use. Some features are only available when you are logged into a user account with a valid subscription.
Get started
Configure your model
The top-right button is where you can access the Global Settings sidebar panel. Here you will find all the options for your model including configuration settings based on the calculation parameters of ISO9613.
In there you will also find the button to open up this guide.
Calculating levels
Calculations are automatically run whenever a change is made to the model. You can temporarily pause this process by clicking the top-left button.
To stop these calculations permanently, under Global Settings change Display to "Noise map off".
Multi-thread calculations
You can speed up calculations by enabling multi-thread calculations. This will utilise more cores of your CPU for faster processing.
Keyboard Shortcuts
A list of all the keyboard shortcuts can be viewed by visiting this page
Saving and sharing
How to save the model
Your model is stored in the browser location bar URL. Bookmark the web page and it will save your model exactly as it is.
Remember to create a new bookmark or update the old one whenever you make any further changes.
Stored in your browser history
Each change you make creates a new entry in your browser history, which means you can undo your changes simply by hitting the back button or going back through the history.
Sharing the model
As with saving, you can share the link and other users can view your model exactly as you have set it up at that moment. Their browser may be different and may recalculate at a different speed but the results will be the same.
The URL is too long!
Click the Short URL button in Global Settings. This will use our server database to store your configuration and automatically convert it to a short URL.
Snapshots
Subscribers can take Snapshots, storing the model with the date and a thumbnail. Snapshots can also be given a name.
What about sharing to non-subscribers?
Users who are not logged-in or do not have a valid subscription will not be able to access the subscription-only features, however any line sources and ground heights that you have added to the model will still be included.
Local Storage
The default method of storing your model is in the URL. If your model has too many objects for this method then you will be given a prompt to switch to Local.
Local Storage uses the web browser site data (similar to the cache) and is better for handling complex modelling.
Use the table below to decide which method is the correct option:
| URL | Local | |
|---|---|---|
| Best for? | Sharing simple models between devices. |
Complex modelling, e.g. detailed topography. |
| Does this work with browser bookmarks (or favourites)? | Yes |
No
Save a Local Snapshot or backup to .dbmap file instead. |
| Can you share the URL? | Yes |
No
Share the backup file instead. |
| Is the Snapshot saved in the User Account? | Yes |
No
Local Snapshots are lost when browser site data is cleared! |
| Are offline images stored with the Snapshot? |
No
Upload the image to your User Account or reload it when prompted. |
Yes
The image is also stored in the .dbmap backup file. |
Export results
In the Global Settings sidebar there are various Export options:
-
Report (PDF)
Generate a PDF of the noise model based on the active mode and current view. Includes tables and charts of receiver levels, spectrums and breakdown of sources.
-
Image (PNG)
Download an image of the noise map. Subscribers export higher resolution images. To download the Cross Section, Ground Heights or 3D view, activate this mode first.
-
Receiver calculations in detail (CSV)
Create a comma-separated file to load into spreadsheet software. All objects are detailed in full and each receiver has a detailed list of sources including calculation breakdown.
-
Export file (and import)
There are various formats to save modelling objects to a file and all these file formats can also be imported. The JSON file format is recommended as it includes the full configuration of all global and object settings. A Google Map object is required for GeoJSON compatibility and for the KML format option, as these use latitude and longitude coordinates. The DXF file format is for CAD and other drawing software.
There is also the option to export object heights as Absolute, where the relative height is combined with the ground height. This option also includes adding roof ridges as line objects.
Complex modelling
Complex modelling scenarios may result in long calculation times. Importing very large files is not recommended as browser behavior may become slow and unresponsive.
Inspecting the model
Inspecting the sound path
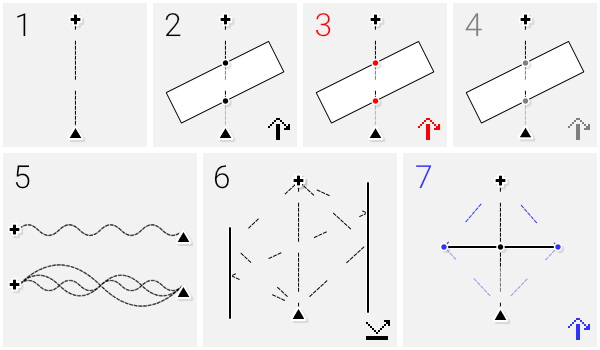
A ray-receiver illustrates the sound paths considered. These include:
- 1 Direct paths from all sources
- 2 Black dots mark barrier intersections
- 3 Red dots indicate the ISO barrier attenuation limit has been reached on some or all of the frequency bands (when the limit is enabled)
- 4 Grey dots indicate that the barrier does not shadow the receiver and is below the line of sight
- 5 When set to "waves" the rays will illustrate the wavelength of the source. When set to "rays" for broadband sources, each dash represents one single frequency band
- 6 Reflected paths when reflections are enabled and screens are considered as reflecting. In the example, not all frequency bands are reflected causing gaps in the dashed line
- 7 Paths considered around vertical edges of screens are illustrated in blue (when enabled in settings)
Compare two scenarios
Calculate the difference in level between two configurations of your model. When activated the following options will appear:
Default scenario
Edit the model as usual.
Alternative scenario
Create a different setup for the objects and settings in the model.
Change between scenarios
View the difference in level when switching to the alternative scenario.
The configuration of the following objects can be compared:
- Point, line and other sources
- Barriers and buildings
- Global settings (environmental settings, barrier attenuation and reflections)
Object position and ground height topography is fixed and cannot be compared.
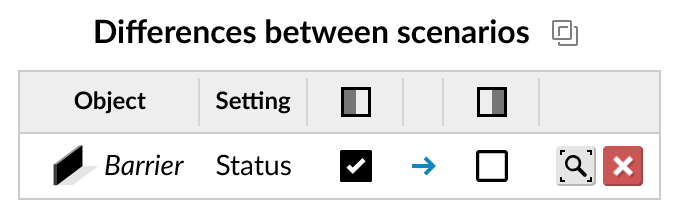
View all the differences in a table
Ground height topography
Ground height objects are only visible in Ground Height mode.
Ground height objects
Triangulation and screening ground
Ground height is triangulated using the height points and lines. The ground is sloped in locations where only two height points are available.
When "Draw ground height triangulation and screening" is selected in the Global Settings, the resulting ground height triangles are drawn onto the noise map and the edges that can cause screening are highlighted in white.
Screening ground is highlighted in white
Barrier heights over sloping ground
When placed on sloping ground, the model considers one end of a flat barrier or one corner of a building as the reference point for the height.
When in Ground Height mode each building and barrier has a basic wireframe of the 3D shape to illustrate the difference in height at each point.
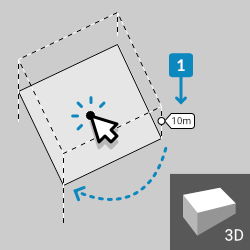
Example of the building wireframe in Ground Height mode
Change the height reference point 1
Hover over the object and Click the center point to shift the reference point to the next available location.
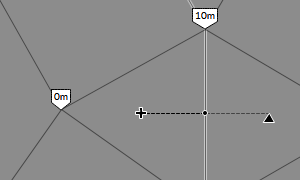
Cross section
Mapping the vertical plane
Cross Section mode allows you to slice through your model and see the vertical location of objects.
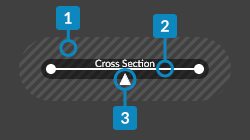
Example of the cross section line
Points within the 1m capture area 1 and objects that intersect the section line 2 will be shown.
Click the line to reverse the direction 3
Pop-up window
Control the cross section height by dragging the top edge of the pop-up window.
Dragging either side of the window will rescale the cross section noise map.
Control object display
The
eye icon will show the projection of all objects and sound rays.
The noise map icon will toggle displaying the horizontal noise map height.
Quick-select a cross section
Click on the following to quickly set the cross section to fit:
- Barrier/Building face or 1m facade (depending on settings). This also sets the cross section height to match
- Sound ray drawn by a ray-receiver
- Accessory line
3D view
View your model in 3D space in a pop-up window
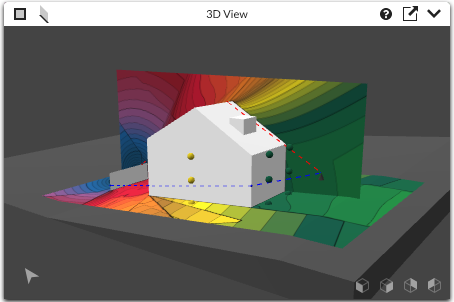
Example of the 3D view
The Compass indicates the direction of view. Click to reset the view orientation.
Rotate the view either with the set direction buttons or Click and drag the window using your mouse.
Navigate from the main area using the Pan tool or by repositioning the 3D view center point. Alternatively, use the right button or arrow keys in the pop-up window.
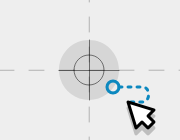
Center point shown in the main window
The view altitude can be matched to the noise map height or raised and lowered with the up and down buttons.
Toggle displaying the horizontal and vertical noise maps.
Sound levels for sources
What is a sound power level?
Sound level meters measure a "sound pressure level" (Lp), which is a decibel value for the sound level experienced at a location.
The source of sound itself is calculated with a "sound power level" (Lw). This is a decibel value that represents the total acoustic output radiated.
They both contain frequency and amplitude information, but the difference is that a sound power level does not include distance information.
Using measurements
Sound power levels can be determined from measurements taken with a sound level meter. There is guidance for this, for example ISO 3740 (machinery) and ISO 8297 (industrial plants).
Calculating a sound power level
If you have a distance included with your decibel level, the decibel figure may represent a sound pressure level. You can use this to calculate the sound power level using the following calculator.
Sound pressure to sound power calculator
...
Frequency information
If you have only a single decibel figure for your sound power and it is for a broadband source, put it in at 500Hz as instructed in ISO9613-2.
The scope of ISO9613-2 only covers the octave bands 63 Hz to 8 kHz. The 31.5 Hz and 16 kHz octave bands are not officially supported by ISO9613-2 but are made available in the model for use, utilising the parameters of the adjacent octave band where necessary.
Leq or Lmax?
Useful for modelling sound sources that are not consistent, the Leq or "equivalent continuous sound level" is a single value that represents the equivalent amount of energy in a given period for a fluctuating source as if it were a steady continuous noise level. For this reason the Leq is always accompanied with a reference to the length of time that it represents.
The Lmax is a maximum level (based on the standard time-weightings: fast, slow or impulse) and is useful for modelling the peak of a noise source, such as a vehicle pass-by.
Sound energy from line sources
For a point source, sound radiates in a sphere and the "sound power level" represents the total sound energy. A line source radiates as a cylinder along the section lengths.
The sound power level is usually considered by the sound energy per meter of length for line sources, or per square meter for area sources. Therefore, the sound power values are different to a point source and are not directly interchangeable.
When the model calculates a line or area source, it divides the object into smaller segments with a point source at the center of each and a level proportional to the size of this segment. Use a ray-receiver to inspect this behavior.
Levels option
When dB/m is selected, the sound power levels are applied to every meter of the source, or square meter for area sources. As the source is increased in size, the total sound energy emitted also increases.
If Total dB is selected, the sound energy per meter is determined by first calculating the length (or area) of the source. Regardless of the size of the source, the total sound energy emitted will always be the same.
For buildings, Total dB is also affected by the Surface Source setting. For example, when “All surfaces emit as one source” is selected, the total area will be of the four walls and the roof together. “Roof and walls are separate sources” will calculate the four walls as a single surface area. If “Edit each surface individually” is selected, the Total dB will be based on the area of that surface only.
Baseline Levels
The “Baseline” feature is for applying a decibel value to the noise map and to individual receivers.
- Shown as a marker: the baseline levels are only used for illustration in the receiver spectrum graphs.
- Added as a source: the baseline levels are added to the calculation using decibel addition, as if it were an existing sound level.
- Applied as a minimum threshold: the baseline levels are used whenever the calculated level is lower.
An asterisk * indicates baseline levels are in effect. A double asterisk ** indicates custom receiver baseline levels are in effect.
Background noise
It is not recommended to use the baseline levels feature for modelling background or ambient noise. Background noise usually cannot be modelled. This is because it is not a type of noise consisting of discrete sources of known distance nor can it be accurately represented by the same decibel level in all locations.
Limitations and assumptions
Assumptions used in calculations
- Noise sources behave as a point (or line for line sources) and are far-field, where inherent directivity is minimal.
- The ground is of a continuous type (a single ground factor).
- Screens are flat with no significant transmission of sound through or under the screen. i.e. not floating above the ground or with empty sections / perforations.
- There is no reverberant field.
Suitable meteorological conditions
Sound propagation is affected by variations in meteorological conditions. Below are suitable conditions taken from ISO9613-2.
- Moderate downwind propagation. This is defined as a wind direction within an arc of 90 degrees with the wind blowing from source to receiver.
- Wind speed between approximately 1-5 m/s, measured 3-11 m above the ground.
- A moderate ground-based temperature inversion, such as is common on clear, calm nights should not significantly affect accuracy.
- Alternatively, the average of varying meteorological conditions over months or years.
For more information about the calculations and their limitations, refer to ISO9613 parts 1 and 2.
Accuracy
It is essential to consider that modelling is only ever an estimate and real-world measurements may differ greatly.
The following table of accuracy is taken from ISO9613-2 based on tests without screening or reflections
| Average height of source and receiver | Distance between source and receiver | |
|---|---|---|
| 0 - 100m | 100m - 1km | |
| 0 - 5m | ±3dB | ±3dB |
| 5 - 30m | ±1dB | ±3dB |
Degree of error
Computer modelling requires a simplification of real-world conditions into basic components. For each simplification there will be a degree of error added to the model. It is recommended that you highlight where these simplifications have taken place.
Vertical edge diffraction
When enabled, lateral paths around vertical edges are found within a flat plane inclined along the direct source-to-receiver line.
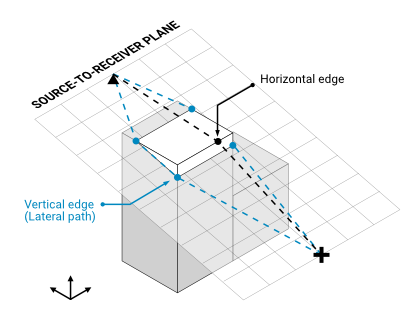
Illustration of the inclined source-to-receiver plane
Convex path option
The lateral path method can be configured to only consider "convex" paths that curve in a single direction and do not zig-zag.
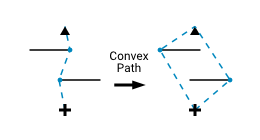
Convex path illustration
Limit distance (ISO recommendation)
ISO17534-3 recommends that lateral paths are limited to vertical edges within the range of the most distant horizontal edge multiplied by 8, with respect to distances from the direct source-to-receiver line. In complex models, applying this recommendation will improve calculation times considerably.
Vertical edges must be shadowing
ISO9613-2 considers the effect of edges that are not screening, for example an observer looking over the top of a wall. This model only accounts for such a situation along the top edges. Vertical edges are only considered when you are in the shadow of the barrier.
Inspect the sound paths
It is recommended to use a ray-receiver to inspect vertical paths and decide yourself the importance of these diffracted levels. Read here for more information on using the ray-receiver
Parameters in detail
Ground Factor
Sound waves will be reflected or absorbed by the ground depending upon the frequency of the sound wave and how porous the ground is (indicated by the "Ground Factor" value G). The barrier attenuation formula also accounts for ground effects.
- For "Hard Ground" G = 0. Hard ground reflects sound waves. Examples include roads and paved areas.
- For "Soft Ground" G = 1. Soft ground is porous and absorbs sound waves. Examples include grass, trees and other vegetation.
- For "Mixed Ground" use a value for G between 0 and 1 that represents the fraction of the ground that is soft.
Plot the ground factor results
...
Temperature and humidity
These values are only used for the atmospheric attenuation part of the calculation.
They should be based on average values of ambient weather relevant to the local area. Typical values are 10, 15 or 20°C temperature and 70% humidity.
The effect on the overall level is usually quite small with changes becoming more noticeable at higher frequencies and longer distances.
The atmospheric attenuation value can be inspected using the export "Receiver calculations in detail" feature.
Barrier Attenuation
The guidance specifies that a screening obstacle meets the following requirements:
- The surface density is at least 10 kg/m²
- The surface is without large cracks or gaps
Apply barrier attenuation limit (20/25dB)
Insertion of a screening barrier will reduce the level of a source using the formulae of ISO9613-2. The guidance states that this reduction in any octave band is limited to 20dB in the case of a single screen or 25dB for multiple screens.
You may want to disable this limit to see what effect it has on the final levels.
Barrier perpendicular dimension > wavelength
Following the method in ISO9613-2, a barrier is only considered to be screening if the horizontal dimension perpendicular to the source-to-receiver line is greater than the wavelength.
You may want to disable this check to explore the unusual effect it causes. For example, as you move around a barrier its apparent width in your field of vision decreases. There will be a point where this width drops below the wavelength of the source and the barrier will no longer be considered to be screening.
Screening Ground
Ground as a barrier
Raised ground levels will behave as a barrier when breaking the line-of-sight between source and receiver. Read here for more information about inspecting ground level screening
Screening ground reflections
In the older method of ISO9613-2:1996, ground effects were removed by the insertion of a barrier. ISO17534-3:2015 recommended to remove only the attenuation due to ground absorption. The checkbox for "Do not screen ground reflections" adds this recommendation.
This option is mandatory for ISO9613-2:2024 as it has become part of the new method.
Reflections
Reflecting surfaces
Screens with a reflection coefficient above 0 are considered to be reflecting and the model will include these reflected sources in up to two screens when First and Second reflections are enabled in the settings. Barrier attenuation along the reflected path is also considered up to the height of the reflecting screen.
Only barrier and building sides make up the reflecting surfaces considered. Reflections from the roof of a building are not considered. Ground reflections are part of the ground effect calculation ("Ground Factor").
Reflection coefficient (ρ) and surface absorption (α)
The reflection coefficient (ρ) is equal to 1 minus the sound absorption coefficient (α) of the reflecting surface; ρ = 1 - α
If the surface absorption is not known then the default reflection coefficient of 0.9 is recommended for building facades and surfaces of industrial facilities (ISO9613-2:2024)
Reflected level in dB
This is the reduction in level applied to the original sound level based on the chosen reflection coefficient.
Facade level (1m)
A "facade level" measurement is one taken at 1 metre perpendicular distance from a large reflecting surface. It is an industry practice for measurements that can be later adjusted to a free-field measurement, one that is outside of the range of influence of reflecting surfaces. The behavior of reflections at less than 1m from the facade are not accounted for.
By enabling this all buildings and barriers will show a dashed line illustrating the 1m facade location. Reflections are only considered at distances beyond this line. Additionally, receiver points will be kept outside of this area when being positioned.
ISO reflector surface size check
For a surface to be considered as reflecting, the size of the surface is compared to the wavelength of the sound using a formula that also considers the angle of incidence and sound path length. This formula can be found in the guidance.
You may want to disable this check to see the result when reflections are always considered for a vertical surface regardless of its size.
Terms of use and your privacy
Rights over using the model
The model is free to use for both private and commercial use but without any warranty.
This is an approximate calculation tool to assist in understanding acoustics and noise mapping (sound level modelling).
It should not replace your own calculations and real-life measurements.
Privacy - what information is online?
The default storage method stores the settings of the model in the URL, which is loaded from the server when first visiting the site and each time the Short URL service is used. As the settings are stored in the URL, anyone with access to the URL will have permanent access to these settings.
When the Local Storage method is selected, the settings of the model are stored offline in the browser memory (similar to the cache) and will be lost if the site data is cleared.
We may sometimes use information about the general activity of the model to improve the service but we treat all modelling activity as confidential and will not pass this information on to third parties.
The User Subscription service stores your account settings and library (snapshots, color schemes, sound levels and images) in our database. This data is never made available to other parties or used for any purpose outside the use of this tool by the registered account. You control this data and can backup or remove it from within your account at any time.
What happens to the data after the subscription ends?
All data is kept for 5 years from the date of the last expired subscription, after which it is permanently removed.
What information is stored locally? i.e. Cookies
“Cookies” and other offline storage options are used for accessing your User Account and for storing your settings and models between sessions. Cookies are not passed to any third-parties for any reason, including advertising.
What about Short URLs?
Short URLs are stored in a secure database without any publicly available index or editing method. Please contact support to request removal from the database.
Calculations
The calculations are done client side, this means that they are not stored anywhere online but are generated by your computer each time you access the page.
Images
Images are referenced by their URL or filename.
It is important that you do not reference images that breach license, copyright or legal restrictions and that you understand that the model will no longer have access to the image if it is removed.
They are not automatically stored on our servers and are only temporarily cached on your computer when generating the model.
Upload Image
Local image files can be uploaded to your User Account to become accessible to others when you share the URL.
Getting help
This tool is made freely available for you to use but unfortunately we cannot offer free technical support if you get stuck.
Please sign up to our subscription service to access technical support.
We are keen to hear feedback. Please contact us using the online form.
References
Calculations
- ISO 9613-1:1993 — Attenuation of sound during propagation outdoors — Part 1: Calculation of the absorption of sound by the atmosphere
- ISO 9613-2:2024 — Attenuation of sound during propagation outdoors — Part 2: Engineering method for the prediction of sound pressure levels outdoors
-
ISO/TR 17534-3:2015 — Acoustics — Software for the calculation of sound outdoors — Part 3: Recommendations for quality assured implementation of ISO 9613-2 in software according to ISO 17534-1.
Quality Assurance and Test Cases: https://dbmap.net/iso17534results
Sound power levels
- BS 5228-1:2009 A1:2014 — Code of practice for noise and vibration control on construction and open sites.
Permission to reproduce extracts from British Standards is granted by BSI Standards Limited (BSI). No other use of this material is permitted. British Standards can be obtained in PDF or hard copy formats from the BSI online shop: www.bsigroup.com/Shop
Color scheme
Javascript Libraries
- SnapSVG (Object drawing)
- THREEjs (3D View)
- Delaunator (Topography triangulation)
- MarchingSquares.js (Contour calculation)
- DXF-Parser (Object import)
- LZ-string (URL compression)
- jsPDF (PDF output)
Select tool
Use this tool to select and move objects.
Using your touchscreen
- Touch and drag objects to move or reshape.
Using a mouse and keyboard
- Click and drag objects to move or reshape.
- Hold Shift to keep movement at right angles.
- Click objects to toggle their various states.
- Right Click objects to edit.
- Hit Esc key to return to this tool while another tool is active.
Edit objects
Using your touchscreen
- Tap on an object to load its settings for editing.
Using a mouse and keyboard
- Click on an object to load its settings for editing.
- Right Click to return to the Select tool.
Pan tool
Using your touchscreen
- Touch and drag to move around the model.
Using a mouse and keyboard
- Click and drag to move around the model.
- Right Click to return to the Select tool.
- Hold Ctrl to activate this tool temporarily while other tools are active.
Note: You can also use the arrow keys to move around the model.
Zoom tool
Using your touchscreen
- Tap to zoom in.
- Two-finger tap to zoom out.
- Touch and drag to draw zoom area.
Note: You can also pinch to zoom.
Using a mouse and keyboard
- Click to zoom in.
- Right click or Shift Click to zoom out.
- Click and drag to draw zoom area.
- Alt Click to fit all objects in the browser window.
Note: You can also zoom using the scale-bar on the left of the screen or with your mouse wheel.
Draw noise map area
- Click and drag or Click two points to set the noise map area.
Using the select tool
- Click and drag the border or corner nodes to reposition.
Draw cross section
- Click and drag or Click two points to draw a new section line.
More information can be found in the guide
Using the select tool
- Click and drag the end nodes or the center line to reposition.
- Click the line to reverse the direction.
- Click on a ray-receiver line or accessory line to set the cross section to fit this line.
How to add a point source
- Click anywhere to insert a point source
What is a point source?
This is a source of noise that radiates from a single point and in all directions in a spherical shape.
Using the select tool
- Click on a source once to disable it
- Click and drag to move it around.
How to add a line source
- Click and drag to draw a single line section
-
Click successively to draw a line source with multiple sections.
- Right click or Double click to end the line.
- Alternatively Click the start point to make it an area source.
What is a line/area source?
A line source radiates sound in a cylindrical shape. An area source, also called a plane source, radiates sound equally from across a surface or zone.
Using the select tool
- Click on the middle of a line/area source to disable it.
- Click and drag to move it around.
How to add a barrier
- Click and drag to draw a single barrier
- Click successively to draw a barrier with multiple sections.
- Right click or Double click to end the barrier.
- Alternatively Click the start point to make it a building.
What is a barrier?
This is an acoustic screen that can attenuate a sound path and reflect them, such as walls and solid fences.
It is not currently possible to model floating barriers or ceilings.
Using the select tool
- Click on the middle of a barrier to disable it.
- Click and drag to move it around.
How to add a building
- Click and drag to draw the dimensions of a four-sided building
- Use Shift to keep it at right angles
To draw buildings with more than four sides, use the Add Barrier tool.
What is special about buildings?
These are the same as barriers except that internal walls are ignored and the area within is not calculated.
Sloping roofs can be added to any buildings with four parallel sides. All other buildings have roofs that are flat and perfectly horizontal.
Reflections are not considered from the roof surface.
The building height is relative to the ground height at the first point. More information can be found in the guide
How to add a receiver
- Click anywhere to insert a decibel level receiver
What is a receiver?
This is a marker where the total decibel noise level is calculated at the specified height along with an optional frequency spectrum graph.
Using the select tool
- Click on a receiver to toggle the frequency graph display
- Click and drag to move it around.
How to add a ray-receiver
- Click anywhere to insert a ray-receiver
What is a ray-receiver?
All sources of noise will have lines drawn directly to these receivers to indicate sound propagation paths or "rays".
When showing waves, the wavelength is drawn to scale.
When showing rays, the dashes represent different frequency bands.
Using the select tool
- Click on a ray-receiver to disable it
- Click and drag to move it around.
How to add an accessory line
- Click and drag to draw a single line
- Click successively to draw a line with multiple sections.
- Right click or Double click to end the line.
What is an accessory line?
These lines can be used for measuring distances or simply for illustration.
You can also convert between accessory lines and other objects.
Using the select tool
- Click on the middle of a line to toggle measurement.
- Click and drag to move it around.
How to add an image or map
- Click to insert an image file or Google Map.
- Drag and drop image files into the browser window.
Using the select tool
- Maps will be inserted to scale. Click and drag to reposition.
- Images will need to be resized. Use the "Calculate Scale" option or the handles for resizing and rotating:
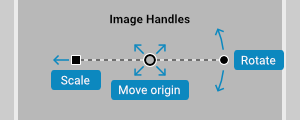
When rotating, hold the Shift key to constrain to right angles
Add a ground height point
- Click anywhere to insert a height point
What is a ground height point?
This defines the ground height at a point and is used for triangulating ground topography and creating slopes.
Add a ground height line
- Click and drag to draw a single line
- Click successively to draw a line with multiple sections.
- Right click or Double click to end the line.
What is a ground height line?
This defines the ground height along the line and is used for triangulating ground topography and creating slopes.