Noise mapping tool
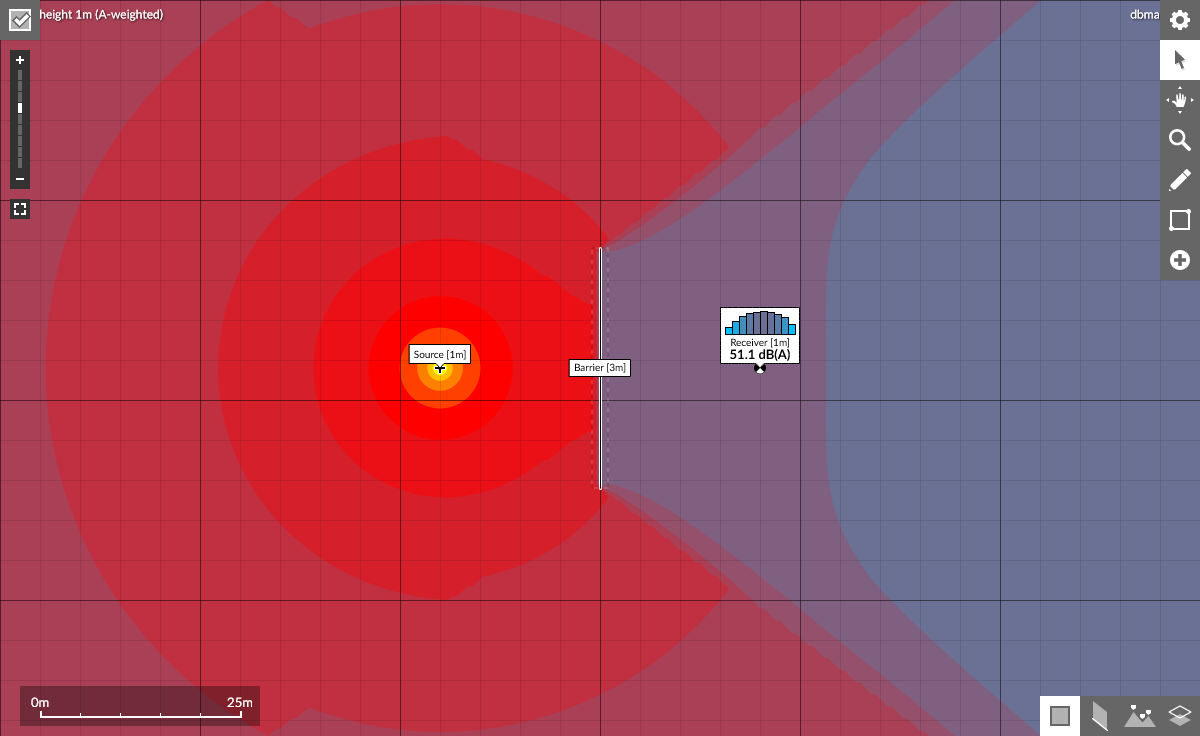
Create sound level models and noise maps for free in your browser.
Add point sources, screening barriers, buildings and decibel receiver points with detailed frequency information. See the sound paths and how these are affecting the levels. Interact with your model, modifying positions and parameters and see the calculation results instantly.
Learn through experimentation how the calculations of ISO 9613 parts 1 and 2 are implemented and how they affect predicted levels. Built into your browser, your model is stored in the location bar making it easy to save and share your interactive models with other people.
Sound propagation and acoustic barrier calculator
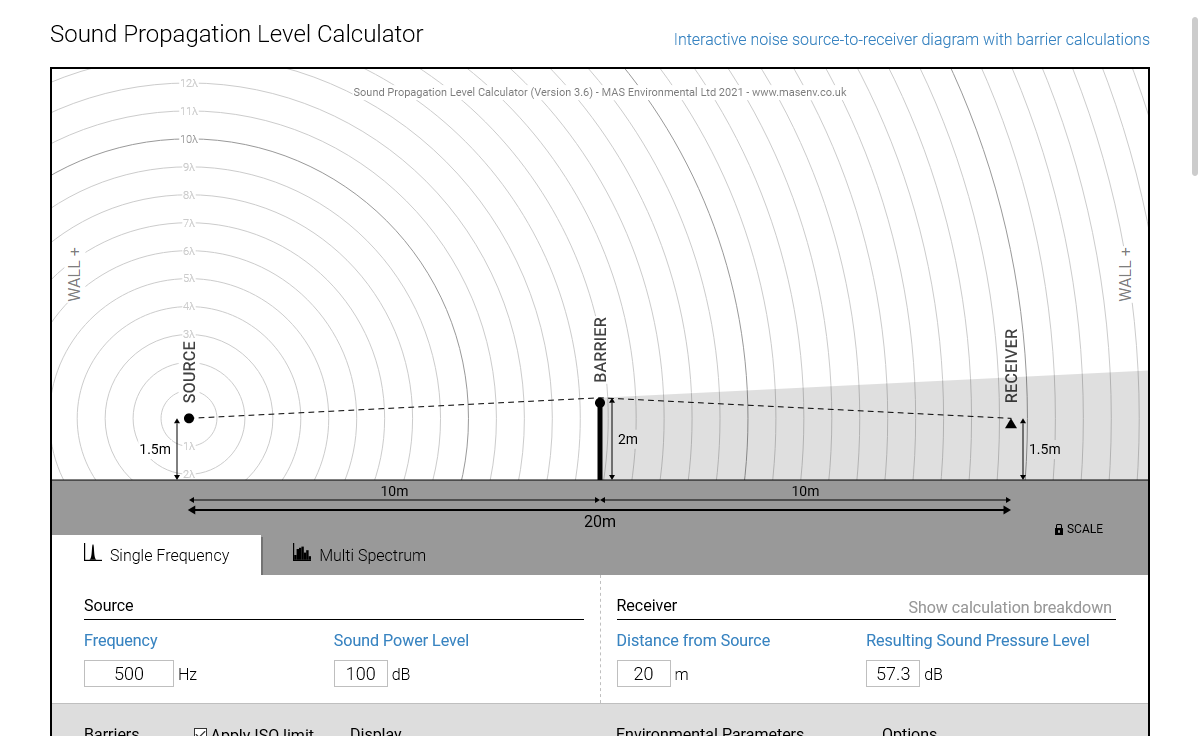
An interactive source, barrier and receiver diagram.
For calculating the sound pressure level of a single source of noise considering sound attenuation due to:
- Propagation over a distance
- Insertion of up to two noise barriers
- Ground effect
- Air absorption
Choose from ISO9613-2 or CNOSSOS-EU for calculation method.
Decibel calculator
For performing arithmetic on sound levels.
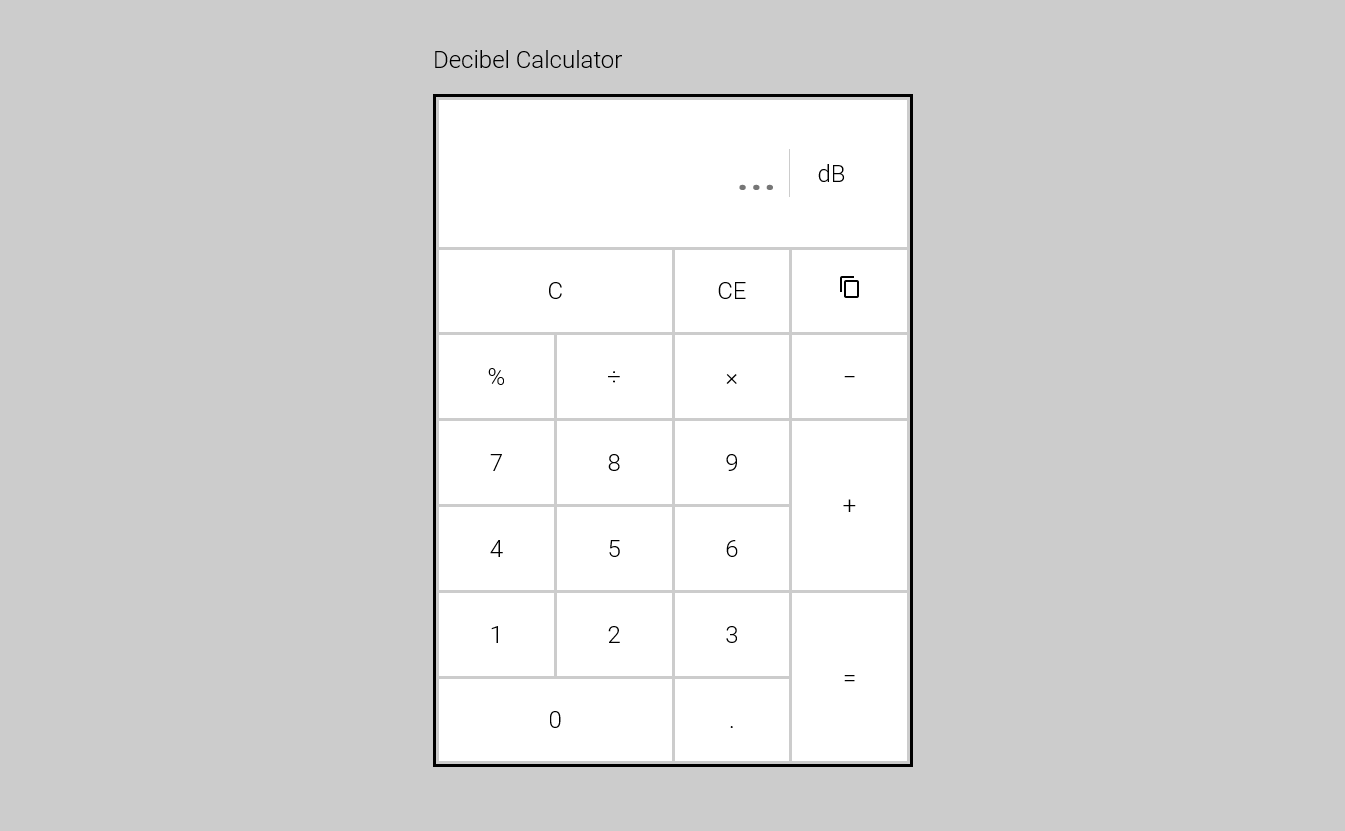
Perform basic arithmetic calculations on decibel sound levels including:
- + addition
- – subtraction
- × multiplication
- ÷ division
- % percent
The calculator displays the formula involved in converting from decibel to linear.
There is also support for the use of your keyboard and numeric keypad similar to using the built-in calculator on your computer.
Multiple noise sources calculator
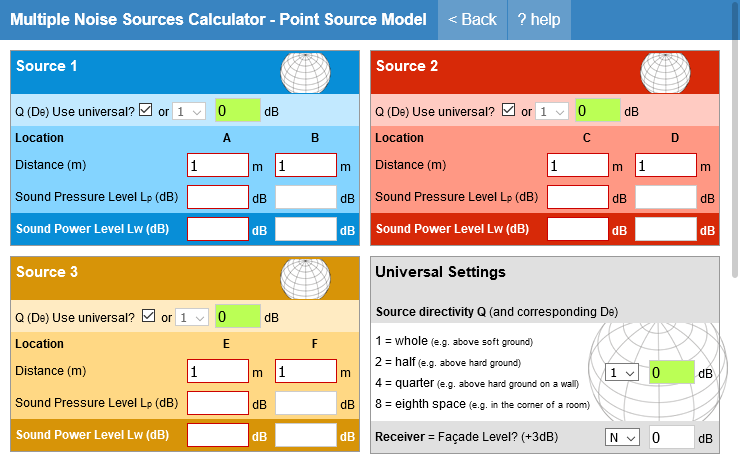
The original point source noise calculator.
Combine up to 3 independent point sources at different distances and durations.
This was our first sound level calculator. Using only the inverse square law for reduction over distance, you can combine up to three sources of noise with different on-time durations.
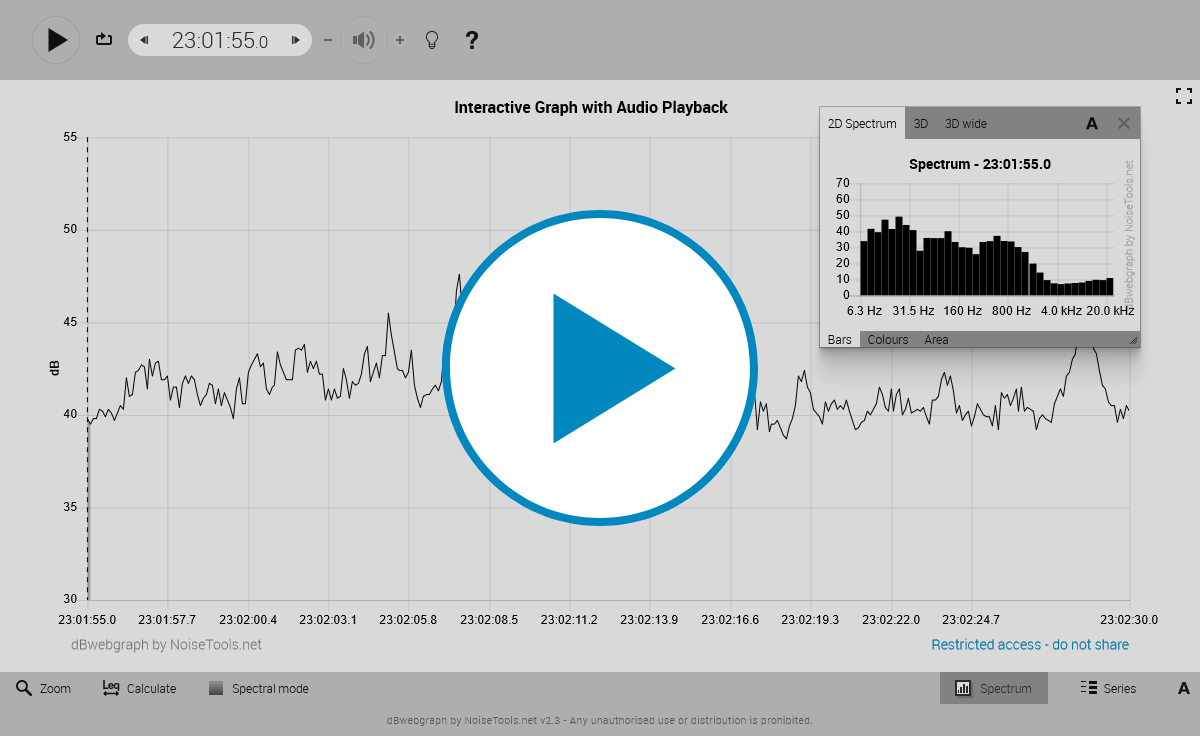
Generate interactive graphs with text and audio files
Plot sound level meter data and listen to the audio in the browser.
Load text and audio files into the browser. The tool will plot a graph of the sound level data over time. Press “Play” to hear the loaded audio file. Click on a point to view the spectrum data in a pop-up window.
Best used with files generated by the dBMacros Excel Add-in.
