For processing raw sound level data and creating graphs for analysis, reports and playback.
![]()
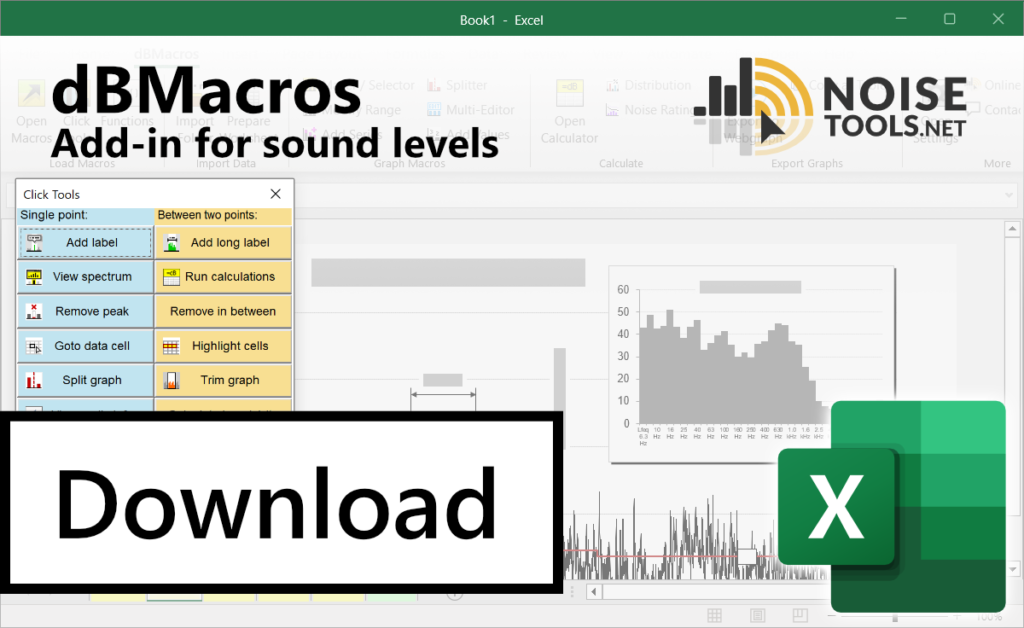
Download:
Head over to the Downloads page get the latest version.
![]()
Video Guides:
Watch the tutorial videos for dBMacros.
![]()
What is free?:
The functions included with the Add-in are free.
Find out more.
![]()
Need help?:
Check out the FAQs or get in touch.
What are dBMacros?
These Excel macros were created in-house at an Environmental Health Consultancy for performing repetitive data-processing tasks quickly and consistently. They are designed to take raw noise data from any sound level meter and generate graphs for visual analysis and reporting.
These graphs then become interactive making it easy to perform decibel calculations, add labels and inspect spectral data and audio. dBMacros uses Excel’s native features to make it a user-friendly decibel analysis application.
Check out the introductory video guide to see the macros in action.
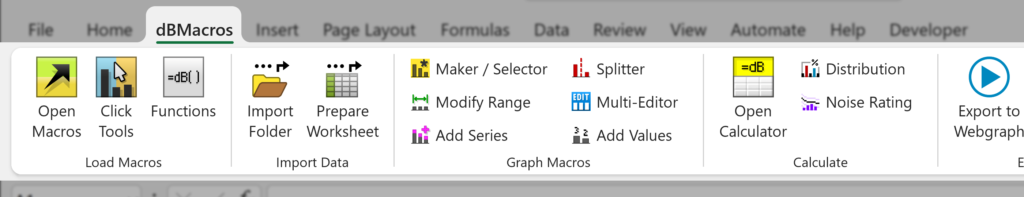
Automated sound level data processing and graph making
The method of operation can be represented with the following three steps:-
Load:
Raw data from a sound level meter
Process:
Layout and headers become consistent for automation
Generate:
• Graph
• Calculate
• Interact
1) Load
All models of sound level meter use different methods of saving and loading data; some store directly to text files that can be opened in Excel, others need to be converted to .XLSX files using other software. As long as the data can be opened by Excel, it can be used by dBMacros.
If your sound level meter generates lots of small files then dBMacros can import all of these into a single workbook with a few simple steps.
To read more about specific devices, check out the page: Importing data and known sound level meters
2) Process
Once it’s in Excel, the macros will process the raw data into a consistent layout for analysis and reporting.
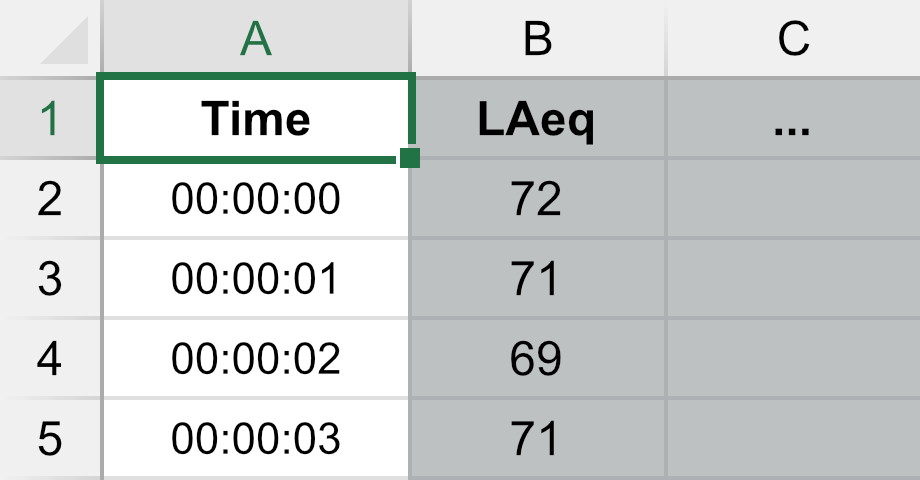
The key to all of this is the time column, which must be in the first column. From here dBMacros can run calculations and automate tasks such as time-aligning the data from multiple sound level meters with each sound level meter on its own worksheet.
Caution: At any time, you are free to edit the data yourself using all of Excel’s features, but doing so might break the data layout rules that the macros rely on to function correctly.
3) Generate
Create Graphs
The dBMacros are specifically designed to turn sound levels into graphs for viewing, analysing and putting into reports. The graphs are made with Excel’s native “Chart” feature but are generated with fewer clicks and with some new interactive features.
Some of the new features include:-
- Series Selector – use checkboxes to decide which series to show on a graph from all your datasheets.
- Splitter – easily generate lots of graphs of shorter time periods.
- Set Range – Specify start and end times or select periods based on gaps in the data.
- Add a Series – A simplified pop-up window makes adding graph lines easier than with standard Excel.
- Multi-graph editor – Select multiple graphs and apply changes to all of them from one place.
Calculate and Add Data
Levels Calculator
Analyse the data between two points on a graph. Features of the calculator include:-
- Calculate overall levels: LAeq, Lmax, LA90, etc.
- Add these calculated levels to your graph as new series with labels.
- View the spectrum data and generate spectrum mini-graphs.
- Calculate sound power levels.
Add Data
Use your existing data columns to generate new results at set time intervals. Useful for generating custom Leq, LA90, Lden, etc.
Add curves to spectrum graphs using industry standards, such as the threshold of hearing.
Plot Noise Rating curves
Generate noise rating graphs from your spectrum data with a single click.
Calculate Distribution
Generate statistics tables from a custom selection of data cells.
Interact
Various tools are available allowing you to interact with your data by clicking on the graphs.
Features of the Click Tools include:-
- Add labels – either to single events or to long periods.
- View spectrum – Click on a peak and see the spectrum data pop up window.
- Find audio file – Find the audio file for an event and open it automatically with audio software.
- Remove a peak – by clicking on it.
- Trim a graph – between two points.
- Calculate Impulsivity – based on the rating method of BS4142.
Generate Webgraphs
Playback in a web browser and share with others by export graphs with audio files to a “webgraph” – an interactive graph with audio playback that runs in an internet browser.
Functions for sound levels
Custom functions for performing decibel calculations are available while the add-in is installed. No license is required to use these.
Some of these functions include:-
- =dBAverage(…) – A decibel version of Excel’s =AVERAGE(…) function for combining Leq levels.
- =dBSumA(…) – Applies incrementing A-Weighting to spectrum data and then performs a decibel logarithmic sum – for turning spectrum data into an LAeq in one step.
- =Lden(…) – Calculates a decibel average with a penalty added to the 4 evening hours (+ 5dB) and 8 night-time hours (+ 10dB) – to calculate Lden (day–evening–night noise level) from raw data.
To learn about all of the functions available, check out the page: Excel functions for sound levels